Exelon
PHI Bill Accessibility Study & Redesign
PHI Bill Accessibility Study & Redesign
PHI Bill Accessibility Study & Redesign
The PHI Bill Accessibility Study & Redesign is an effort by Exelon to increase the accessibility and usability to initially PHI customers, but also all other Exelon utility company subsidiary customers as well.
Tools: Figma, Miro, UserTesting, UserZoom, Various Screenreaders
Length: 4 months
The PHI Bill Accessibility Study & Redesign is an effort by Exelon to increase the accessibility and usability to initially PHI customers, but also all other Exelon utility company subsidiary customers as well.
Tools: Figma, Miro, UserTesting, UserZoom, Various Screenreaders
Length: 4 months
The PHI Bill Accessibility Study & Redesign is an effort by Exelon to increase the accessibility and usability to initially PHI customers, but also all other Exelon utility company subsidiary customers as well.
Tools: Figma, Miro, UserTesting, UserZoom, Various Screenreaders
Length: 4 months
Full Study Overview
Full Study Overview
Full Study Overview
Background & Context
Background & Context
Background & Context
Improving the accessibility and overall bill design will ensure that all customers, including those with visual impairments, can effectively access their bills.
The goals of this study are to:
1.) Learn industry best practices and standards regarding bill design.
2.) Inform and guide our questions and designs for our study hypotheses.
3.) Learn what content, information, and level of detail are most useful and preferred by our customers.
Methodology & Metrics
Methodology & Metrics
Methodology & Metrics
Over the course of this study, there was a total of…
35 total research participants
15 different graphics tested
9 bills compared
Over the course of this study, there was a total of…
35 total research participants
15 different graphics tested
9 bills compared
Over the course of this study, there was a total of…
35 total research participants
15 different graphics tested
9 bills compared
…and we undertook 3 different studies as a part of this effort.
…and we undertook 3 different studies as a part of this effort.
…and we undertook 3 different studies as a part of this effort.
Usability Testing
Usability Testing
Usability Testing
Moderated Interviews
Participants completed bill-specific tasks, simultaneously providing live feedback.
Accessibility
Gained live and unique feedback from visually impaired customers using screen readers.
Participants
We interviewed 5 participants representing the U.S. general population of visually impaired screen reader users.
Competitive Analysis
Competitive Analysis
Competitive Analysis
Competitive Matrix
Highlighted findings in each focus area to identify industry best practices.
Focus Areas
We compared typography, color, QR code use, graphics, credits & charges, nested tables, and phone number placement.
Competitors
We analyzed 9 different companies, inside and out of the utility industry.
Preference Testing
Preference Testing
Preference Testing
Unmoderated Survey
Participants completed a survey testing multiple designs against each other.
Bill Content
Found customer preferences regarding bill level of detail, data visualization, and overall structure.
Target Participants
They survey was completed by 30 participants, across both PHI and ComEd.
Key Learnings
Key Learnings
Key Learnings
In this study, there were 3 key learnings we were able to take away.
1.) Customers favor familiar bill designs & layouts
We learned users prefer familiar bill designs with email-friendly layouts, as opposed to a more modern, mobile-friendly approach.
2.) Headings & key information should be clear and descriptive
We learned user prefer distinct and descriptive headings, text, and graphs, so they can quickly locate and understand important details on their bill.
3.) Users prefer different levels of detail in each section of their bill
We learned users prefer varying levels of detail in sections of their bill. They preferred less detail in their charge breakdown graphs, but more detail in their charge details.
Part 1: Moderated Accessibility Usability Testing
Part 1: Moderated Accessibility Usability Testing
Part 1: Moderated Accessibility Usability Testing
Background & Context
Background & Context
Background & Context
In this part of the study, we assessed the accessibility of a tagged version of the current-state PHI bill PDF by testing it with visually impaired users.
Testing the current -state tagged bill with visually impaired users will help provide invaluable insights regarding accessibility, which may not be apparent through internal review alone.
Key Insights
Key Insights
Key Insights
Key information and headings should be clearer and more descriptive
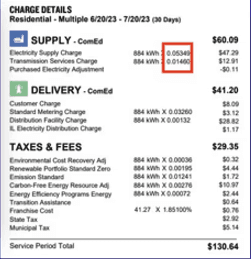
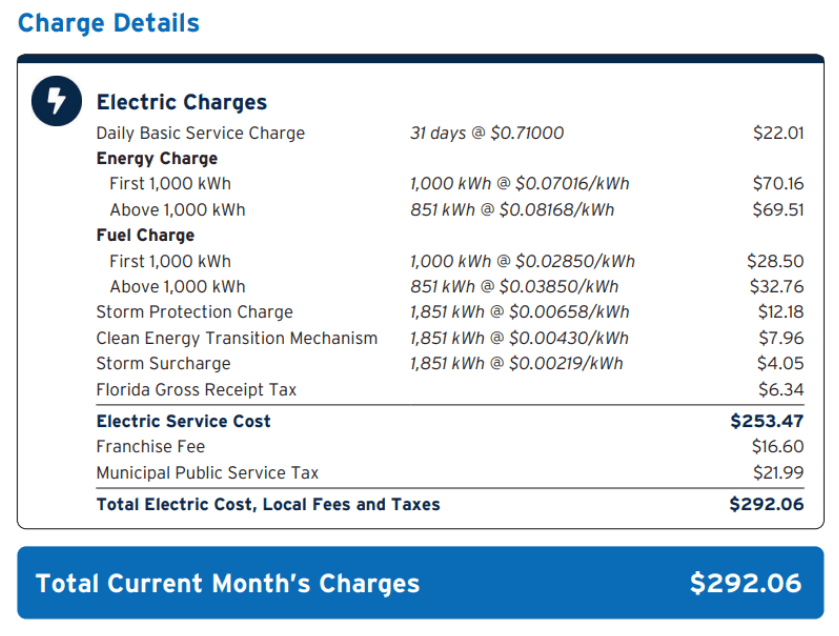
Charge details are already easily understandable and navigable.
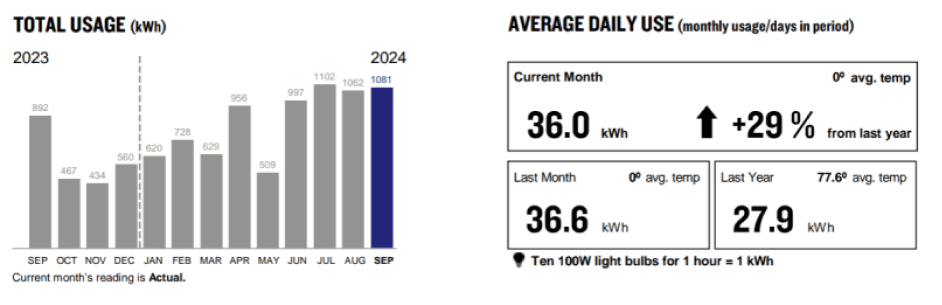
The current charge breakdown and usage charts are unclear.
Key information and headings should be clearer and more descriptive
Charge details are already easily understandable and navigable.
The current charge breakdown and usage charts are unclear.
Key information and headings should be clearer and more descriptive
Charge details are already easily understandable and navigable.
The current charge breakdown and usage charts are unclear.
Additional Insights
Additional Insights
Additional Insights
Lack of Labels for Numbers Creates Confusion
Lack of Labels for Numbers Creates Confusion
Lack of Labels for Numbers Creates Confusion
Additional Insights
Additional Insights
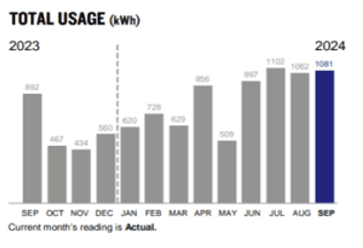
Numbers that appear without their corresponding labels can be confusing for users. For example, in the total usage infographic or charge details, participants struggled to imediately understand what the numbers refer to.
They expressed a preference for having labels directly associated with the figures to avoid the need to navigate to a different line or heading to recall their meaning.
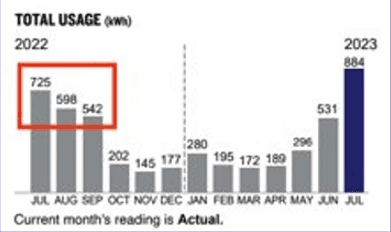
"I mean even though at the top of the heading it says kilowatts per hour, they could still say April - 189 kilowatts per hour, you know what I mean? So that you're reminded that that's what you're reading." - Research Participant
"I mean even though at the top of the heading it says kilowatts per hour, they could still say April - 189 kilowatts per hour, you know what I mean? So that you're reminded that that's what you're reading." - Research Participant
"I mean even though at the top of the heading it says kilowatts per hour, they could still say April - 189 kilowatts per hour, you know what I mean? So that you're reminded that that's what you're reading." - Research Participant
Additional Insights
Additional Insights
Finding Contact Information Could Be Easier
Finding Contact Information Could Be Easier
Finding Contact Information Could Be Easier
Additional Insights
Additional Insights
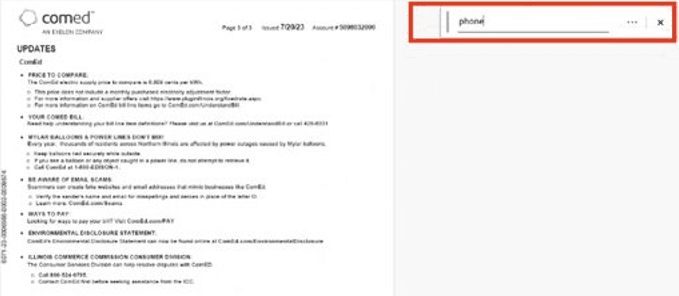
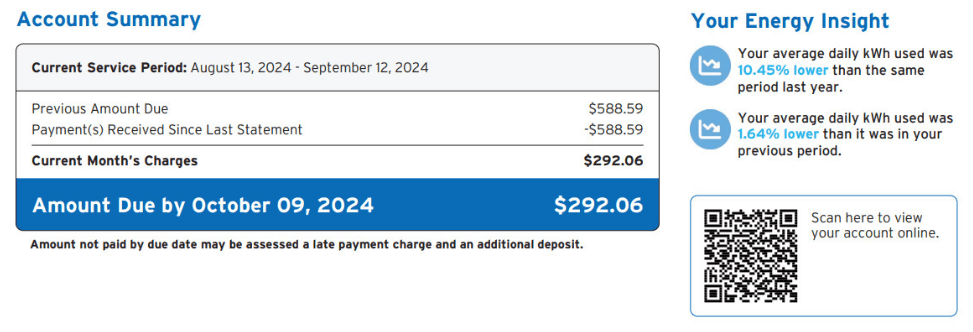
Participants expect to find contact information under familiar labels such as "Contact Us" or "Phone". When these standard labels are missing, some struggle to locate the details, as they focus on searching for specific wording rather than scanning through content.
As a result, they may overlook the actual contact information information provided in the document.
Additional Insights
Additional Insights
Chrome's Built-In PDF Reader Does Not Leverage All Embedded Tagging
Chrome's Built-In PDF Reader Does Not Leverage All Embedded Tagging
Chrome's Built-In PDF Reader Does Not Leverage All Embedded Tagging
Additional Insights
Additional Insights
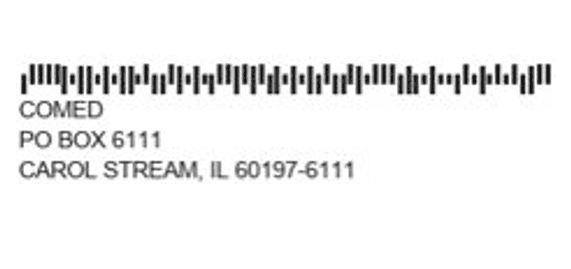
For example, when opening the PDF using Chrome's built-in PDF reader, the barcode is not recognized by the screen reader, rendering it incomprehensible for users.
As a result, when navigating through that section, participants encounter a reading disruption with no context or explanation of the barcode's purpose.
Part 2: Competitive Analysis
Part 2: Competitive Analysis
Part 2: Competitive Analysis
Background & Context
Background & Context
Background & Context
In this part of the study, we analyzed competitor bills to identify industry best practices, features, and opportunities for improving our own bill design.
Comparing competitor bills helps us make informed design decisions based on real-world insights from other companies, giving us a competitive edge.

Examples
Examples
Examples
In this part of the study, we analyzed competitor bills to identify industry best practices, features, and opportunities for improving our own bill design.
Comparing competitor bills helps us make informed design decisions based on real-world insights from other companies, giving us a competitive edge.
Findings & Best Practices to Consider
Findings & Best Practices to Consider
Findings & Best Practices to Consider
Maintain a contrast ratio of 4:5:1 for text and graphics, and 3:1 for large text
Use QR codes to provide a convenient option for tech-savvy users
Use easily distinguishable and concise graphics and visual aids
Separate bill sections to maintain a consistent and logical flow (i.e. a blocked off contact section)
Use ample spacing, remove extraneous details, and proper text alignment in nested tables for better readability
Part 3: Unmoderated Preference Testing
Part 3: Unmoderated Preference Testing
Part 3: Unmoderated Preference Testing
Background & Context
Background & Context
Background & Context
In this part of the study, we gathered feedback on different bill designs between the current-state, an experimental design, and what a separate redesign team had been working on.
Gathering feedback on concrete and tangible designs ensures our designs align with customer preferences, and prevents us from simply validating our own assumptions about the bill design.
Current-State
Experimental Design
Redesign Team
Insights
Insights
Insights
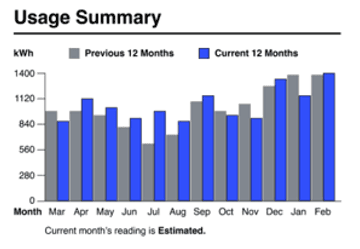
Customers Disfavor a Mobile Usage Chart Design
Customers Disfavor a Mobile Usage Chart Design
Customers Disfavor a Mobile Usage Chart Design
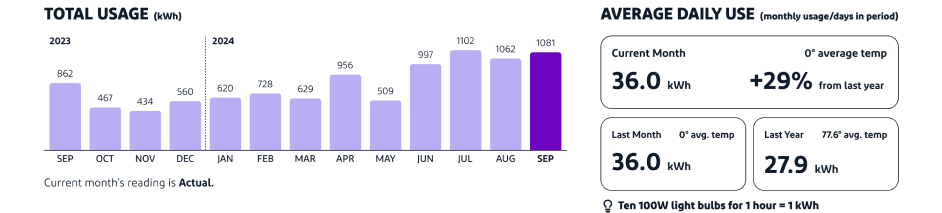
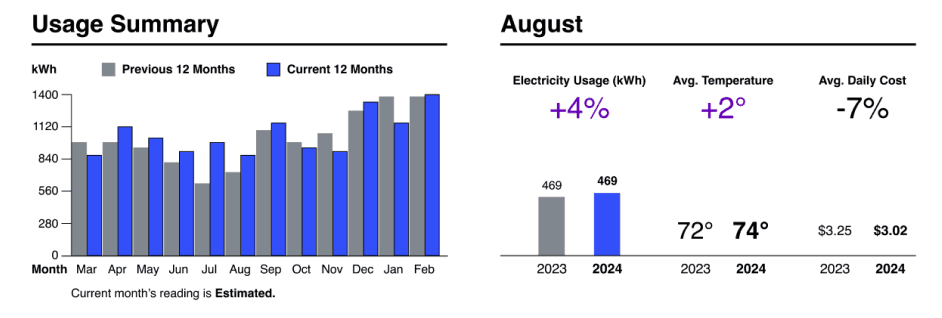
Most customers who primarily view their bill via email preferred the above current-state design (left), or the legend-based design from the redesign team (right).
Over time, we anticipate that users would prefer a design that evolves to be more modern and mobile-friendly.
With this in mind, we updated the usage chart and overall bill layout.
Insights
Insights
However, our study revealed that customers overwhelmingly preferred both the existing and legend-based usage chart.
Beyong familiarity, a key reason for this preference is that most customers access their bill via email. The current-state and legend-based design better align with the format and presentation style they are accustomed to in their email communications.
Insights
Insights
Customers Prefer Less Detail In Their Charge Breakdown
Customers Prefer Less Detail In Their Charge Breakdown
Customers Prefer Less Detail In Their Charge Breakdown
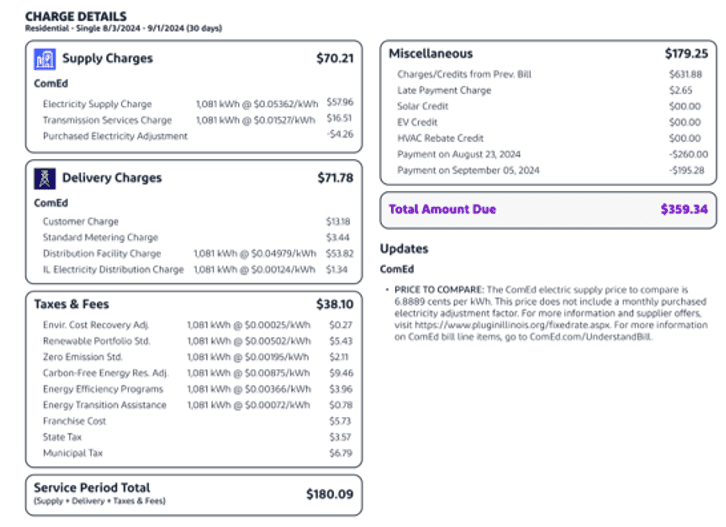
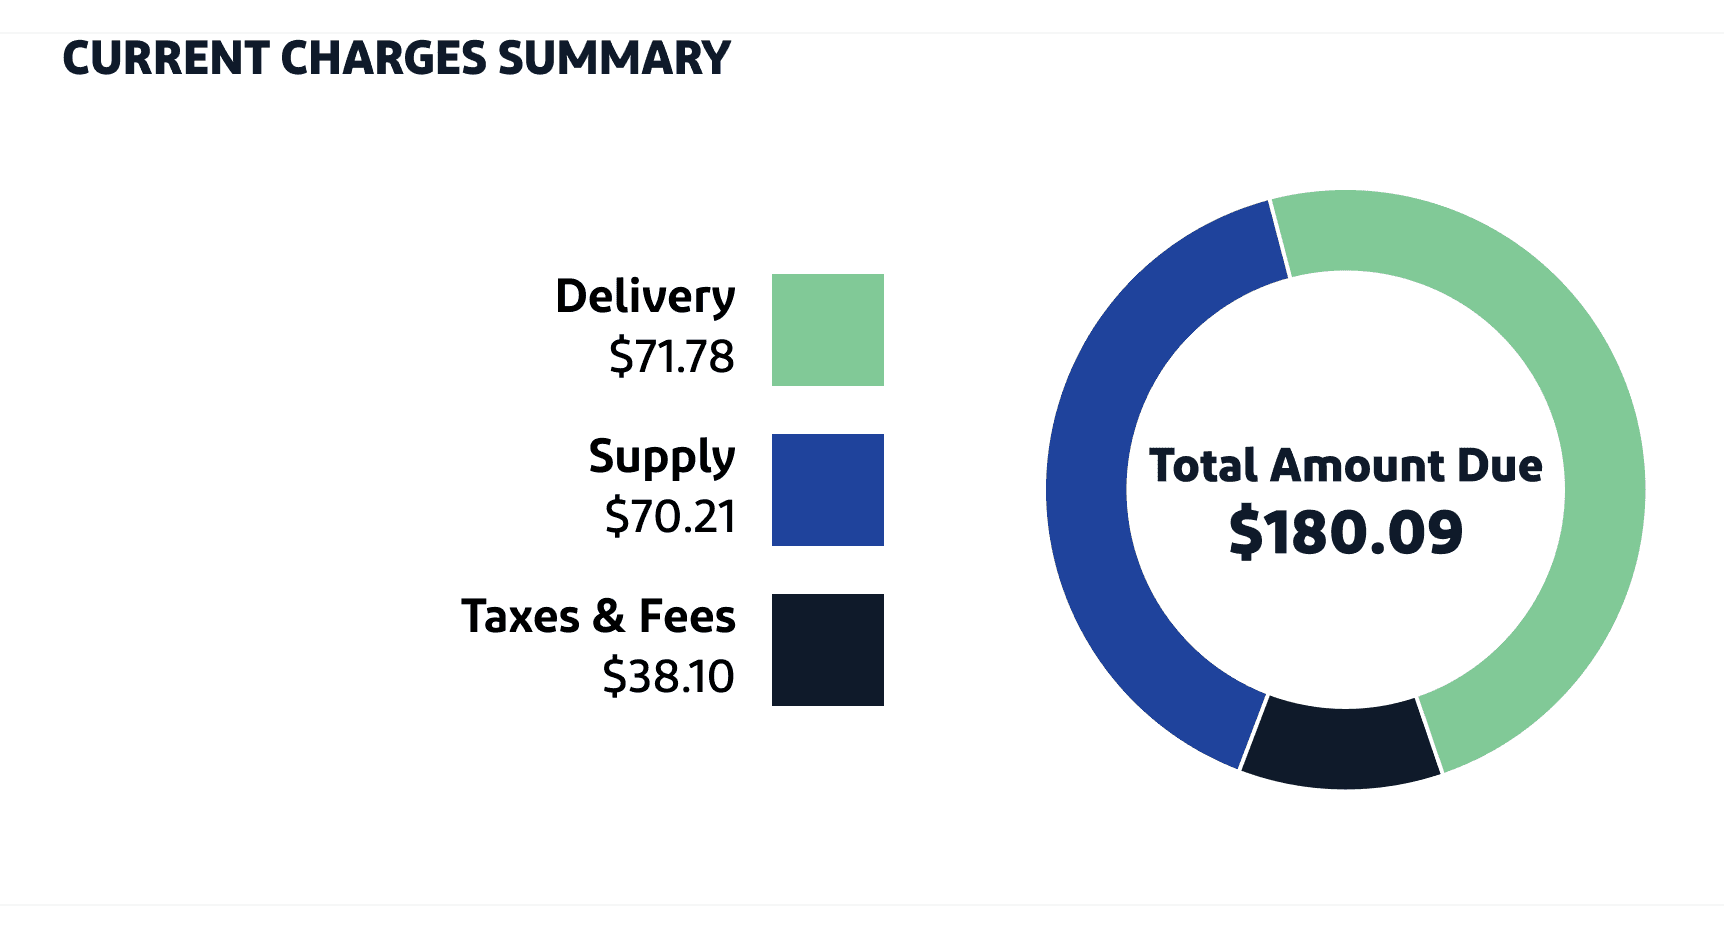
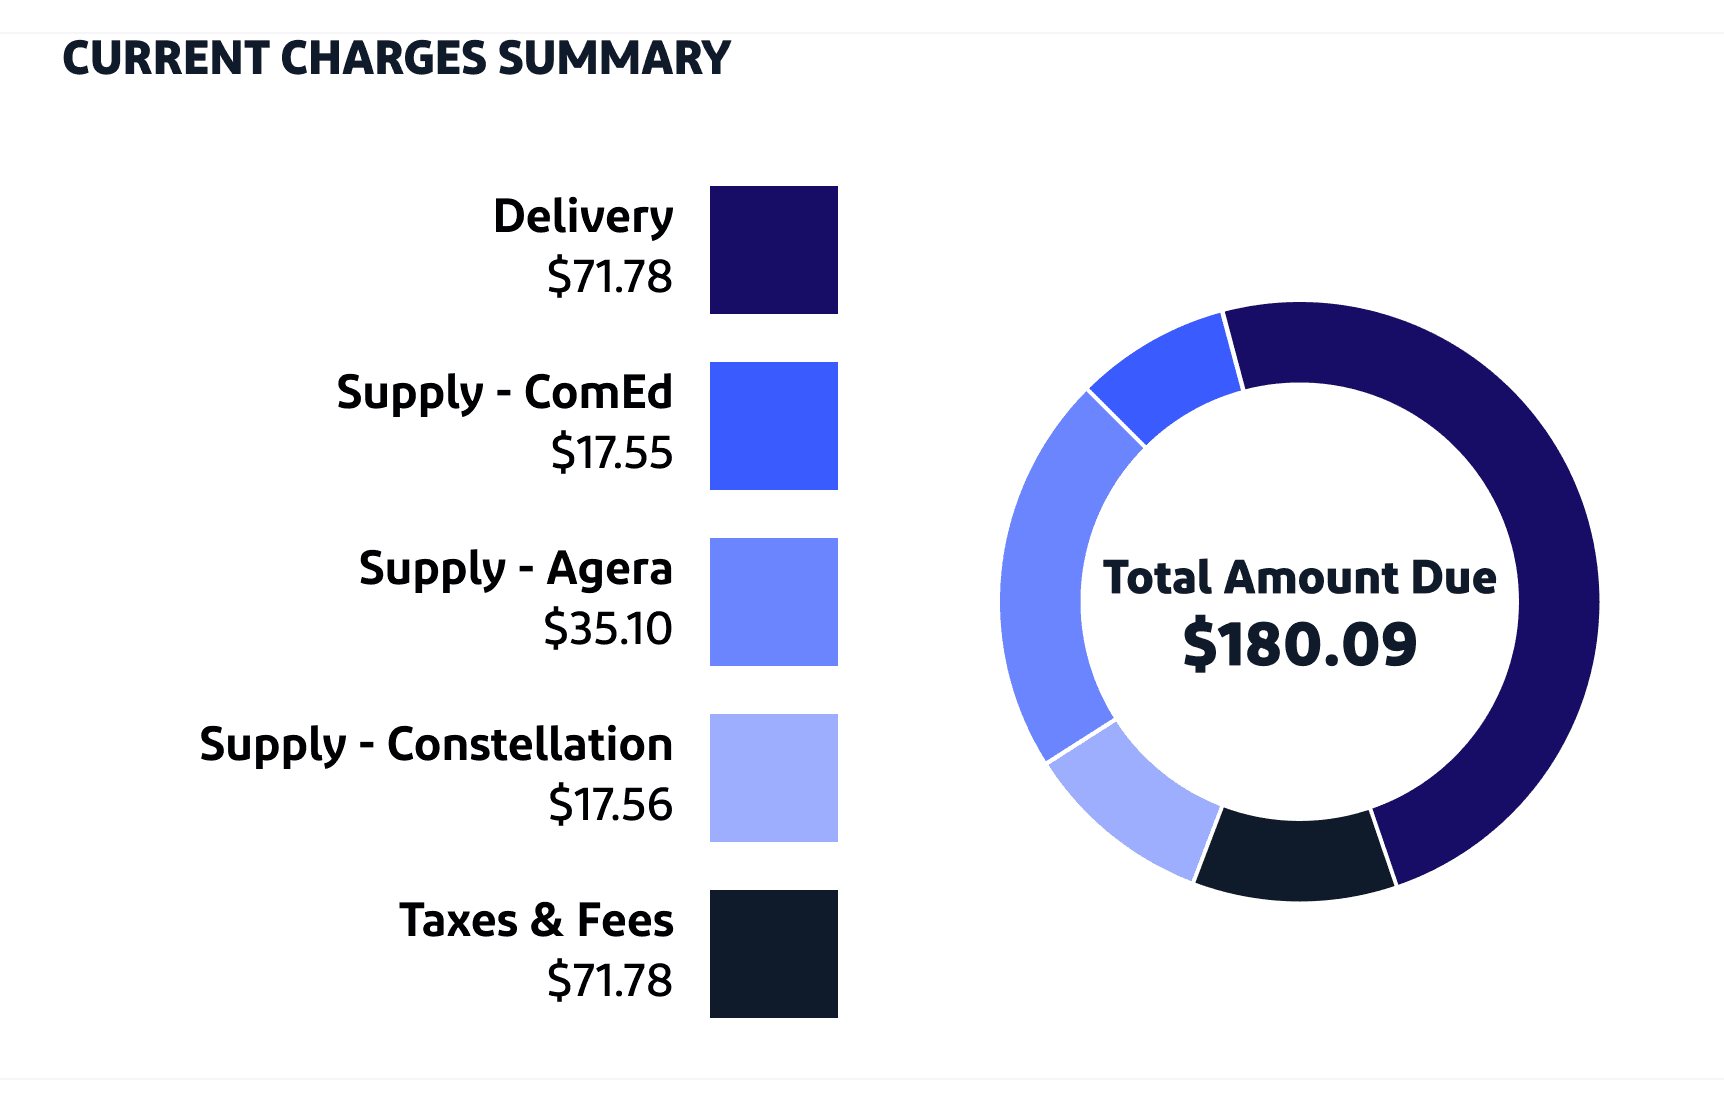
Our goal is to provide transparency and help customers better understand their bills. To achieve this, we introduced designs with a detailed breakdown of their suppliers.
Our goal is to provide transparency and help customers better understand their bills. To achieve this, we introduced designs with a detailed breakdown of their suppliers.
Our goal is to provide transparency and help customers better understand their bills. To achieve this, we introduced designs with a detailed breakdown of their suppliers.

Option A (Less Detail)

Option B (More Detail)
Insights
Insights
However, we found that customers preferred a higher-level summary that displays only the total supply amount.
Customers found a deeper supply breakdown to be irrelevant.
However, we found that customers preferred a higher-level summary that displays only the total supply amount.
Customers found a deeper supply breakdown to be irrelevant.
However, we found that customers preferred a higher-level summary that displays only the total supply amount.
Customers found a deeper supply breakdown to be irrelevant.
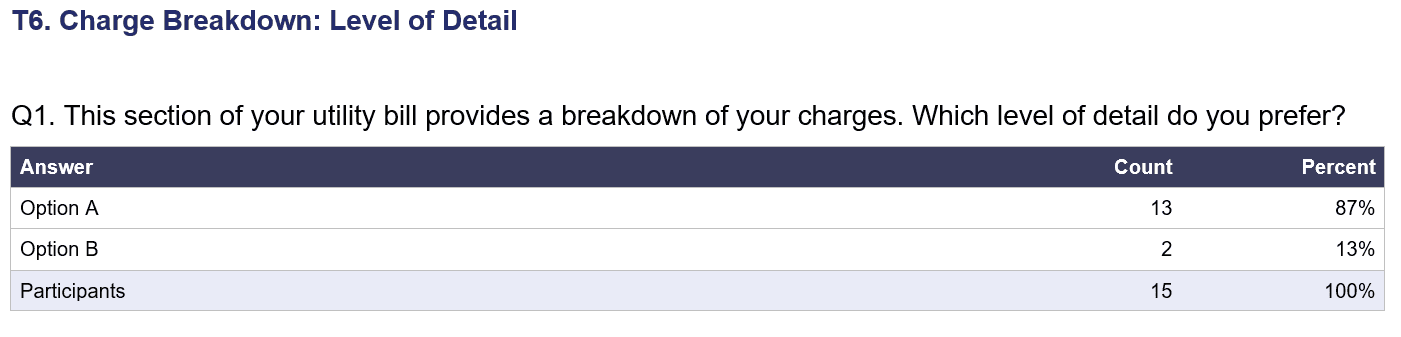
"[I] don't need detail of third party suppliers, [I] don't care about it." - Participant
"[Option A is] the quickest to absorb without excess information." - Participant
"[I] don't need detail of third party suppliers, [I] don't care about it." - Participant
"[Option A is] the quickest to absorb without excess information." - Participant
"[I] don't need detail of third party suppliers, [I] don't care about it." - Participant
"[Option A is] the quickest to absorb without excess information." - Participant
Insights
Insights
Customers Prefer More Detail In Their Charge Details
Customers Prefer More Detail In Their Charge Details
Customers Prefer More Detail In Their Charge Details
As previously stated, our goal is to enhance transparency and customer bill comprehension. While customers showed little interest in the source of their energy, our study revealed that they valued more detailed breakdowns of their miscellaneous charges.
As previously stated, our goal is to enhance transparency and customer bill comprehension. While customers showed little interest in the source of their energy, our study revealed that they valued more detailed breakdowns of their miscellaneous charges.
As previously stated, our goal is to enhance transparency and customer bill comprehension. While customers showed little interest in the source of their energy, our study revealed that they valued more detailed breakdowns of their miscellaneous charges.
This is likely because users recognize that energy costs are inevitable, but they are more engaged when it comes to understanding potential savings.
This is likely because users recognize that energy costs are inevitable, but they are more engaged when it comes to understanding potential savings.
This is likely because users recognize that energy costs are inevitable, but they are more engaged when it comes to understanding potential savings.
Insights
Insights
Customers Prefer A Higher-Contrast Design with Larger, Bolder Fonts
Customers Prefer A Higher-Contrast Design with Larger, Bolder Fonts
Customers Prefer A Higher-Contrast Design with Larger, Bolder Fonts
To improve readability and visual accessibility, we explored different text and infographic styles. We found that customers preferred darker, bolder fonts and higher-contrast graphics, as these elements made the information easier to read and navigate.
Customers felt that lighter, smaller text and subtle visuals were less effective in conveying key details.
Darker/Higher Contrast (Preferred)
Other
"People are getting older, and larger print, bolder print, all make reading easier" - Participant
"The colors and visual style made this very easy and attractive to understand and comprehend." - Participant
"People are getting older, and larger print, bolder print, all make reading easier" - Participant
"The colors and visual style made this very easy and attractive to understand and comprehend." - Participant
"People are getting older, and larger print, bolder print, all make reading easier" - Participant
"The colors and visual style made this very easy and attractive to understand and comprehend." - Participant
Areas of Opportunity
Areas of Opportunity
Areas of Opportunity
Future Tasks
Future Tasks
Future Tasks